ELK data ingestion options
When it comes to ingesting data into the ELK stack (Elasticsearch, Logstash, Kibana), you have a few different options, mostly depending on your use cases.
Below are the three main ways of doing so.
Beats
Beats are lightweight data shippers, written in Go. You run them on the same machine as the source of the data you want to send to Elasticsearch, whether that’s a Docker container, a virtual machine, or your personal laptop. You then configure the relevant Beat to keep an eye on what’s interesting to you. This could be watching changes to files, monitoring the network interfaces, and any other relevant metrics, then gathering that data and shipping it over into some kind of destination That destination could be Elasticsearch, Logstash, Kafka, or something else of your choosing.
Logstash
Logstash is a data collection and transformation engine. You can typically use it as a step before getting your data into your final destination, allowing you to mold your data to your liking first. It’s pretty lightweight compared to other ETL (Extract, Transform, Load) tools while serving the same purpose. Once transformed it can push to a destination of your choice, such as Elasticsearch.
Elasticsearch
Some don’t realise but Elasticsearch itself has a RESTFul API for data ingestion, including bulk insertion.
Now, you have different categories, or use cases, of data ingestion that affect how you choose to ingest data. These categories are: logs, metrics, security, and business analytics.
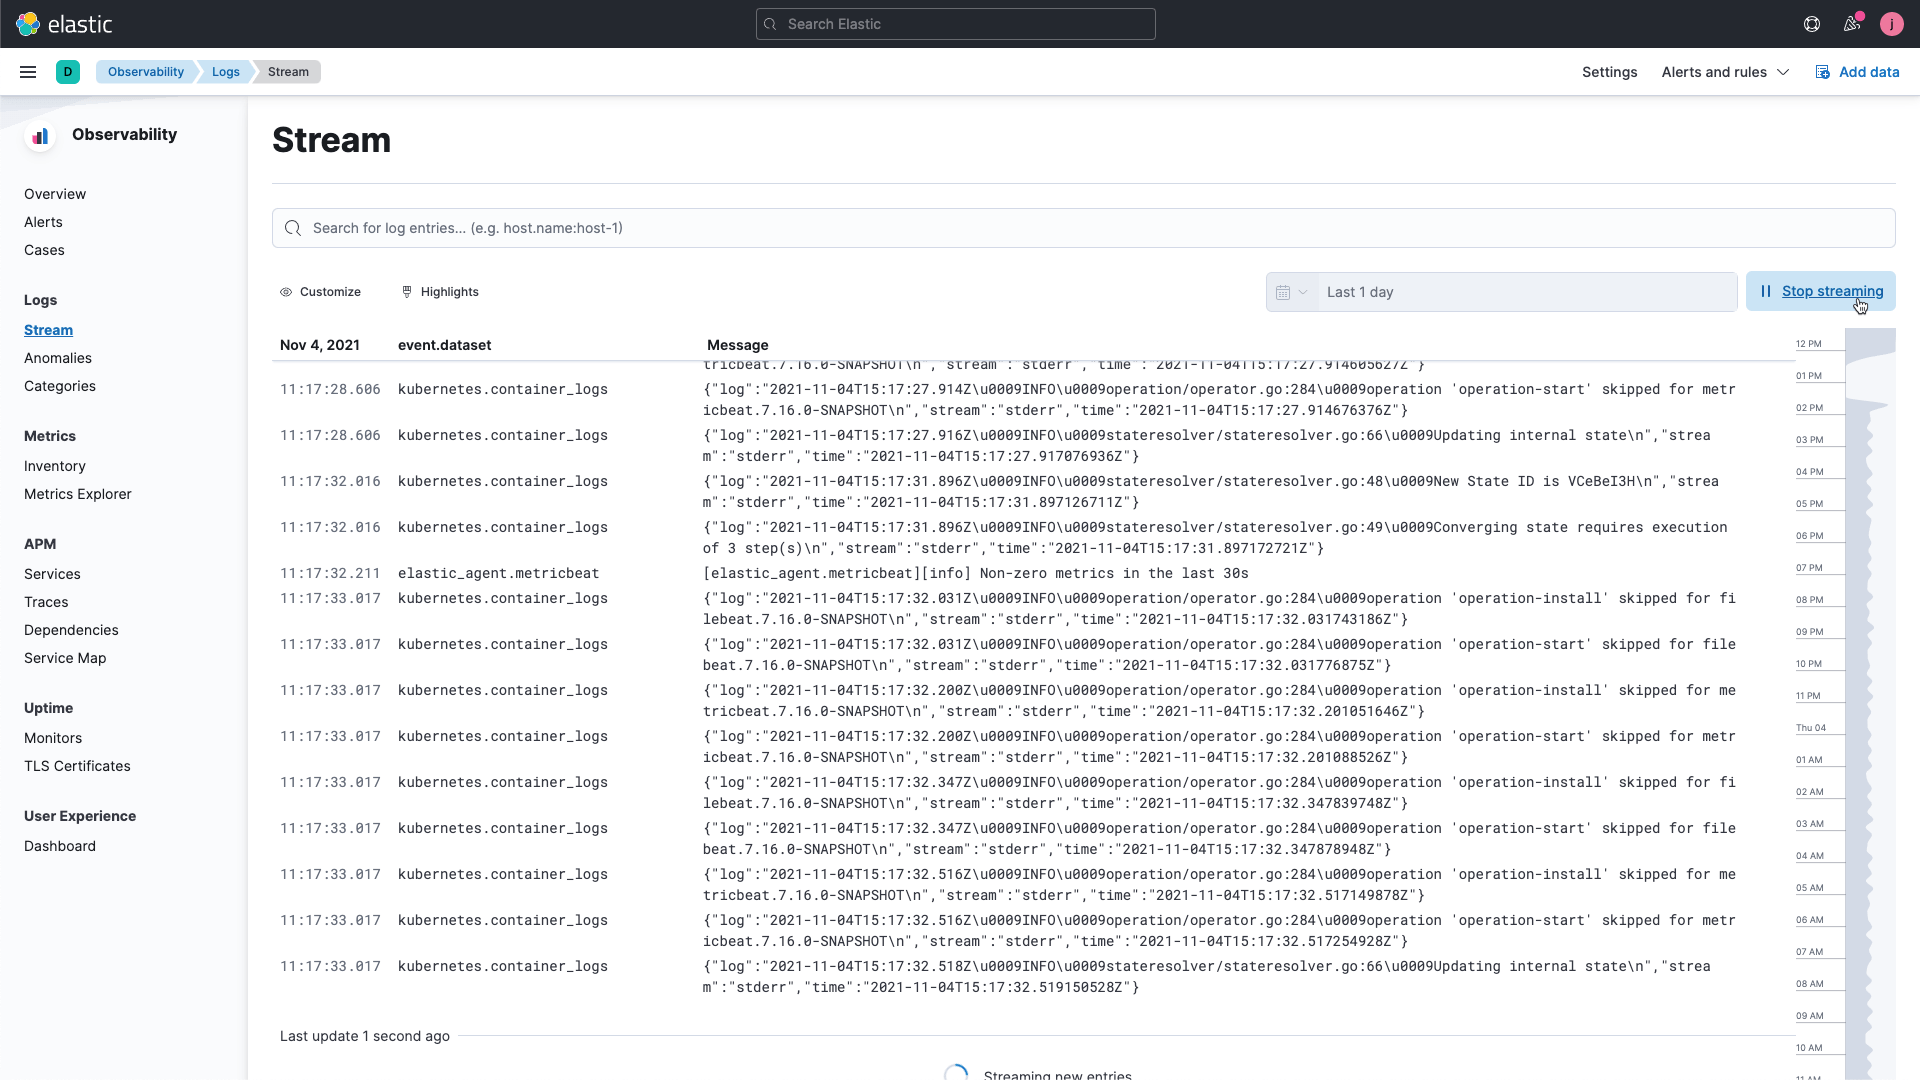
Logging Data
As a definition, you can think of a log as a file that has lines inside of it where every line is representing a log event (usually, sometimes a log event can be over multiple lines). These logs could come from anywhere: your operating system, Docker containers, web servers, message queues, databases, and so on.
When you have data sources that are logs in nature, the most popular tools are Filebeat and Winlogbeat. This is where you would typically start.
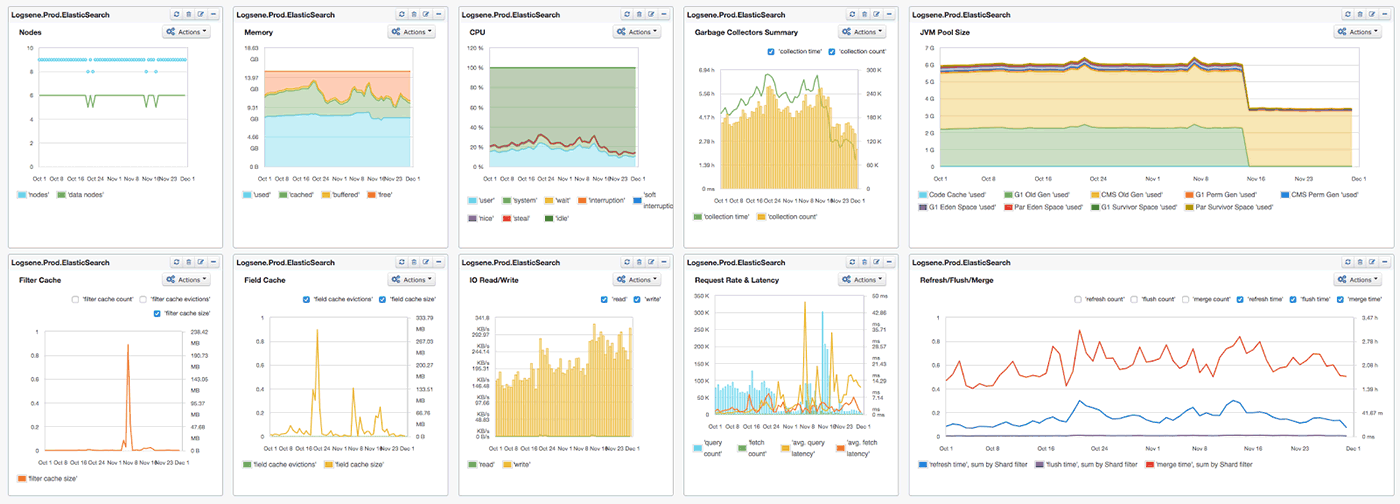
Metrics Data
These are data sources that are numeric in nature. So these would be system metrics you might get from the same types of sources as above, but also things like your networking or cloud infrastructure, uptime, custom applications you have written, and so on.
If you have data of this nature, you start with Metricbeat. But if it’s network related, Packetbeat is likely what you’re looking for. Logstash itself has inputs that support numeric metric input. So if you’re using GCP for example, it has an input adapter for the PubSub mechanism. You can look up whether Logstash has adapters that support the metric data sources that you’re looking for.
Security Data
This type of data source could be auditing logs from your operating system or a third-party security event management system. It could also include general networking information such as DNS Packets, Firewalls, etc.
For these, you can still use Filebeat, Packetbeat, and Logstash, but you also have Auditbeat available to you, which allows you to monitor Linux audit logs more easily.
Business Analytics Data
These data sources really depend on what you're using. They could be your databases, as well as SAAS offerings like Salesforce, GitHub, social media accounts, and content management systems. You likely won’t have a Beat to get your content into Elasticsearch, so Logstash comes back into play and you’ll have to think about how you can use it with whatever disparate or niche systems you want to ingest data from.
References
https://www.elastic.co/blog/how-to-ingest-data-into-elasticsearch-service
https://www.elastic.co/webinars/ingesting-data-into-elasticsearch-part-1